Ericsson DDM
The DDM (Device and Data Management) cloud connector will integrate Meshlium as a DDM gateway with minimal effort and configuration.
More information on DDM and IoT Accelerator:
https://www.ericsson.com/ourportfolio/products/iot-accelerator?nav=productcategory002|fgb_101_973
Register Meshlium in DDM
Register a gateway with the pre-configured Meshlium gateway type in your device network in DDM. If the Meshlium gateway type is missing in your instance of DDM, please contact DDM support. If you are unfamiliar with DDM, you can read more about how the platform works on http://docs.appiot.io/.
Configuration
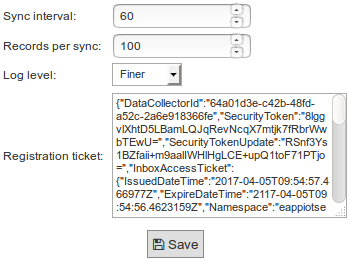
The figure below shows the main configuration page for the DDM cloud connector. The following is a description of the components in the connector's User Interface.

Sync Interval: Sets the number of seconds to synchronize with DDM. The default value is 60 seconds. Please take into consideration when setting this value that Meshlium is a resource-constrained device. The shortest synchronization interval is 30 seconds.
Records per sync: Sets the number of sensor values read from the Meshlium's database per synchronization. The default value is 100 records per synchronization. It is not recommended setting this value any higher than 200 due to the memory limitations of Meshlium.
Log level: This controls the log output from the DDM connector. The log levels Severe and Warning will only output messages that in some way may affect operational functionality of the cloud connector. All other levels of logging, except Off, will output general events from the cloud connector. The log level Info will focus on events regarding actions taken by the connector. Other levels, like Fine, will output third party library logs as well.
Registration ticket: The registration ticket that will be used by the gateway integrated in the cloud connector.
Sensor mapping: Toggles the sensor mapping table used to translate sensor types between Meshlium and DDM. An example of the table can be seen in the next image, where the left hand side lists the sensors from Meshlium and the right hand side lists the sensors URI from DDM. Note that the empty value represents an unmapped sensor. The DDM cloud connector will only try to synchronize sensor values that are not empty.

As shown in the figure below, add custom mappings in the case that your sensor type is not present in the standard set of sensor types on the Meshlium. Click the 'X' next to the mapping to remove a mapping.

Serial numbers: The drop-down lists all the Waspmotes available and/or registered in DDM. The configured state between DDM and the Waspmotes are displayed next to the Waspmote ID. There are 3 states: Not registered, Registered and Registered (Not seen). The Not registered state represents a Waspmote transmitting to the Meshlium that is not registered in DDM. The Registered state represents a Waspmote transmitting to the Meshlium that is registered in DDM. This is the state where the connector synchronizes data with DDM. The last state, Registered (Not seen), is when a Waspmote is registered in DDM but has no record of transmitting to the Meshlium. The button next to the drop-down will copy the selected Waspmote ID to your clipboard.

DDM Gateway Status and Start/Stop: The round icon indicates the current state of the connector. The icon will be either green or red depending on if the connector is running or not. The green start button will start the connector. When clicked, it changes into a stop button. To stop the connector press the red stop button.

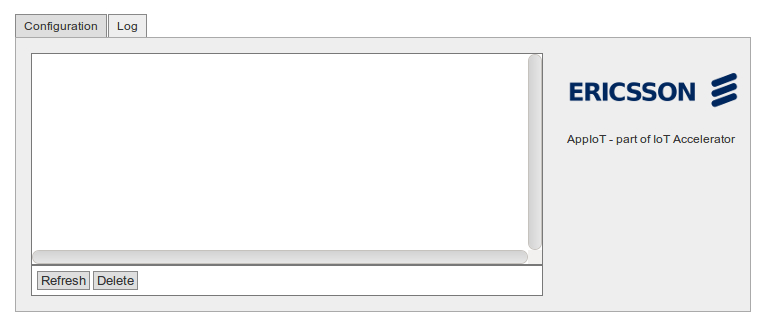
Log tab: As seen the following screenshot, you can review the latest logs from the connector. The refresh button will reload the log window and display the latest logs. The delete button will empty the log file on the Meshlium unit.

Setup
- Stop the connector, if it was running.
- Supply the registration ticket field with a valid ticket.
- Start the connector. It will begin listening for notifications from DDM.
- Create device types in DDM to represent your Waspmotes. The cloud connector will receive notifications about devices and sensors modifications.
- Set the desired synchronization interval and limit, please select these parameters with care.
- Set the desired logging level.
- Restart the connector. It will initialize internal structures according to newly created and modified sensors.
- Map the Meshlium sensor types to the corresponding sensor hardware types in DDM.
- If you are using user-defined sensor types on the Meshlium, make sure to add these to the connector's sensor mapping table.
- A restart of the connector is always required for saved changes to take effect: stop the connector before saving, the press the "Save" button and the the "Start" button.
Notes
- When registering a Waspmote device in DDM, the device name used in DDM must correspond to the Waspmote name that the developer used in the Frame instance.
- The cloud connector can handle sensor types with multiple fields if they are defined in the sensors table on Meshlium. Example: ACC has three fields and translates to APPIOT0_ACC, APPIOT1_ACC and APPIOT2_ACC. The APPIOT prefix will appear on all multi-field types and the numbering is the index of each field value.
- The cloud connector does not support multi-field, user-defined sensor types.